Note: in the web version we have renamed this feature to Navigator, since it does not offer function and action look-up.
The Finder provides a look-up and completion of available data and function names, saving one from tedious typing and ensuing typing errors.
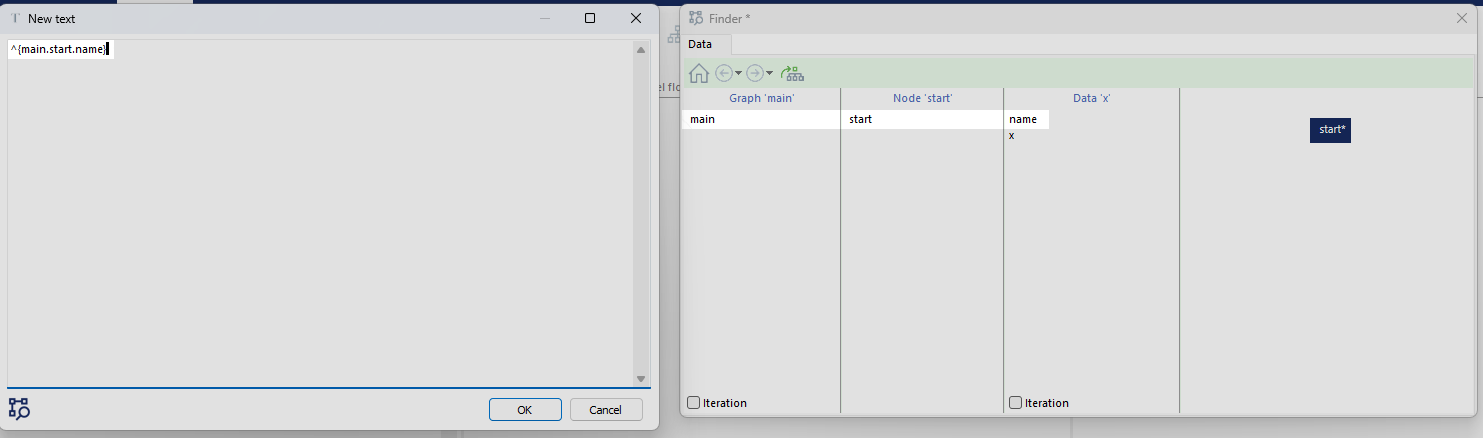
Invoke the Finder with [F6] or via the top menu under Search > Finder. It will stay visible without blocking the application until closed.
In this screenshot a reference to ^{main.personal_details.name} is added to a text by looking it up and selecting it with the Finder.
Selecting an item from the decision tree
The Finder has two tabs: ‘Data’ and one of ‘Functions’ or ‘Actions’.
The Data tab is divided into four columns. First graphs, then nodes, then data. The rightmost column is a view of the current graph. You can select graphs, nodes and data on first three panels, or navigate using this graph view.
The Functions or Actions tab lists and describes functions or actions, grouped by category.
Double-clicking an item will add the appropriate reference on the field you are editing, whether it be a formula, a condition or some text field.
If the Finder can do something useful for the field you are editing, the Finder’s bar will turn green.
Navigator
The Navigator provides a look-up and completion of available graph, node and variable names, saving one from tedious typing and ensuing typing errors.
Note: the Desktop counterpart of this feature is called the Finder, offering also function lookup, which the web version does extensively and only though (automatic) code-completion.
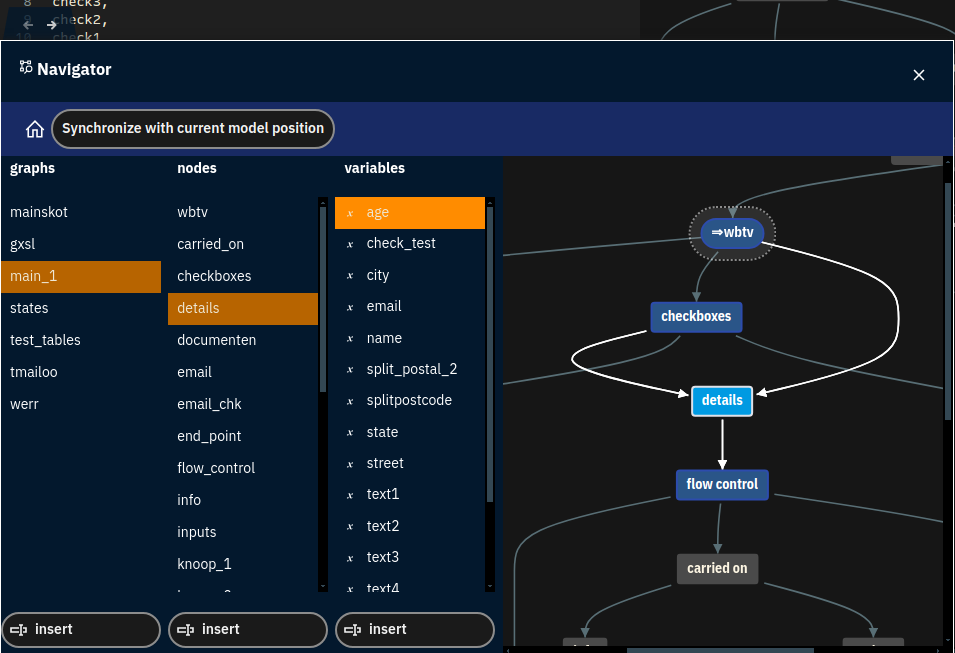
Invoke the Navigator with [g] then [v] or via the Navigator icon at the bottom of the Graph panel. It will stay visible without blocking the application until closed. The little arrow buttons at the top let it snap to one of the two or three panels.
In this screenshot a reference to ^{main_1.details.age} is added to a text by looking it up and selecting it with the Navigator.
Selecting an item from the decision tree
The Navigator is divided into four columns. First graphs, then nodes, then variables. The rightmost column is a view of the current graph. You can select graphs, nodes and data on first three panels, or navigate using this graph view. Everything is accessible with mouse and keyboard (Arrows, Tab and Enter key).
Press the [insert] button at the bottom of the list containing the item to add the appropriate reference in the field you are editing, whether it be a formula, a condition or some text field. Mouse users can also double click the item itself.
In text fields, the item will be quoted with a caret and curly braces, e.g.: ^{main.start.question1}, whereas in formulas no quotes will be used.
If the Navigator can do something useful for the field you are editing, that field will have a green background.
The two buttons at the top let one quickly move to the Home position or back to the current position inside your model.